
What Is a Good Body Fat Percentage? Charts by Age, Gender & Goal
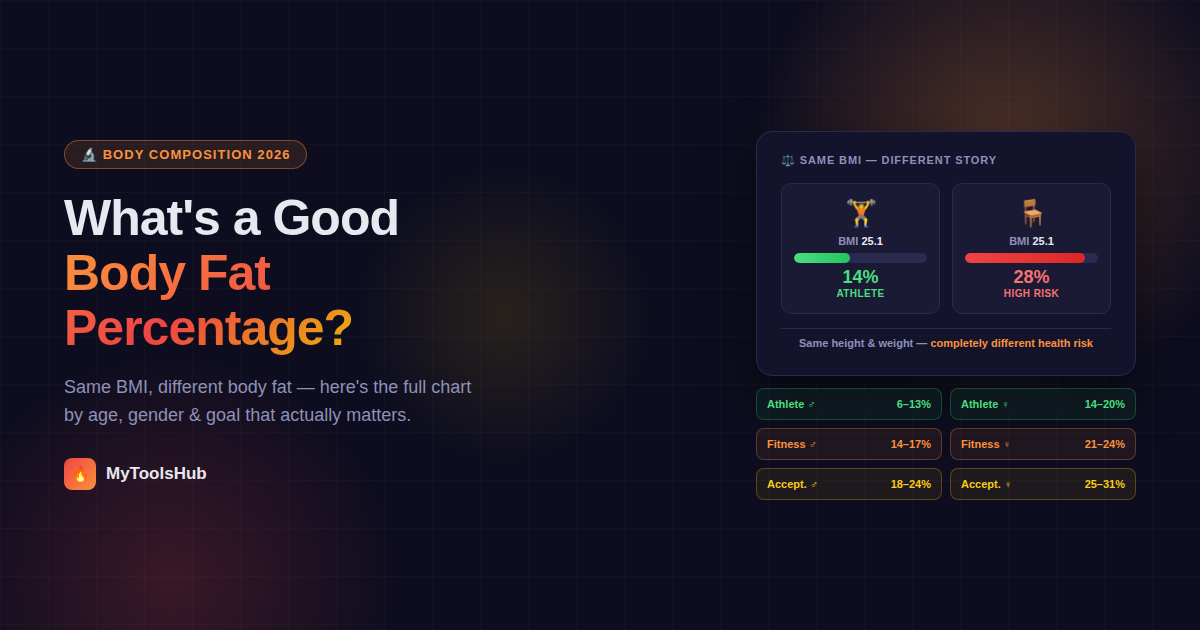
Consider two men, both 30 years old, both 80 kg, both 5'10". Their BMI is identical — 25.1, just above the "normal" threshold. But one is a recreational weightlifter with 14% body fat and substantial muscle mass. The other is sedentary with 28% body fat and very little muscle. Same height, same weight, same BMI. Completely different body compositions, completely different health risk profiles.
This is the central limitation of BMI, and the reason body fat percentage exists as a separate, more informative measurement. Where BMI can only tell you whether your total weight is proportionate to your height, body fat percentage tells you what that weight is actually made of. This article walks through the reference ranges used by sports medicine organizations, how they shift with age and sex, what they mean differently for athletes, and how to get an accurate measurement without spending money on a clinical scan.
Why Men and Women Have Fundamentally Different Ranges
The first thing that surprises most people looking at body fat charts is how different the male and female ranges are. A woman at 25% body fat is in a healthy, fitness-oriented range. A man at 25% is already in the high-acceptable to borderline category. This isn't a double standard — it reflects genuine biological differences in how fat is stored and what it's for.
Women require significantly more essential fat than men due to reproductive hormones. Estrogen promotes fat storage, particularly subcutaneous fat (the fat just beneath the skin), as part of reproductive biology. The essential fat minimum — the absolute floor below which basic physiological function breaks down — is 10–13% for women and only 2–5% for men. This difference cascades through every category on the body fat chart, which is why direct percentage comparisons between men and women are inherently misleading.
Below essential fat, the consequences are serious for both sexes: hormonal disruption, immune dysfunction, bone density loss, and in women, cessation of menstruation. Female athletes approaching 12–13% body fat need careful monitoring — the International Olympic Committee has formally identified Relative Energy Deficiency in Sport (RED-S) as a serious risk at these levels.
The ACE Body Fat Categories — The Most Widely Used Reference
The American Council on Exercise (ACE) classification is the most commonly cited framework in fitness and clinical settings. When a gym assessment or health app categorizes your body fat, it's almost certainly using ACE categories:
| Category | Men | Women |
|---|---|---|
| Essential Fat | 2 – 5% | 10 – 13% |
| Athletes | 6 – 13% | 14 – 20% |
| Fitness | 14 – 17% | 21 – 24% |
| Acceptable | 18 – 24% | 25 – 31% |
| Obese | 25%+ | 32%+ |
A few things worth noting about how to read this table. The "Fitness" category — 14–17% for men, 21–24% for women — is the range most health and fitness professionals describe as the realistic long-term target for active adults who are not competitive athletes. The fitness category delivers most of the health benefits of the athlete range with a fraction of the required discipline. The "Acceptable" category is genuinely healthy for most purposes — not a warning sign — but sits above the range associated with optimal metabolic markers.
How Body Fat Ranges Shift With Age
The ACE table above applies broadly to adults, but it doesn't account for a well-documented reality: body fat naturally increases with age even when weight stays the same. This happens primarily because muscle mass declines with age (sarcopenia), and as muscle decreases, fat typically fills some of the resulting volume. A 55-year-old at 22% body fat may be in a healthy, age-appropriate range, while a 25-year-old at the same percentage would be slightly above optimal.
Here is how age-adjusted ranges typically look across the lifespan, drawing from InBody, BodySpec DEXA scan data, and clinical guidelines:
| Age Group | Healthy Range — Men | Healthy Range — Women |
|---|---|---|
| 20 – 29 | 8 – 20% | 16 – 28% |
| 30 – 39 | 11 – 22% | 17 – 29% |
| 40 – 49 | 13 – 24% | 19 – 31% |
| 50 – 59 | 15 – 25% | 22 – 33% |
| 60+ | 17 – 27% | 24 – 35% |
A healthy 20-year-old woman might aim for a fitness range of 21–24%, while a healthy 50-year-old woman might naturally drift into the 25–28% range due to the hormonal shifts of perimenopause and menopause. Pursuing a 20-year-old's body fat percentage at 55 is often an unrealistic and metabolically unnecessary goal — the health benefits of moving into an age-appropriate range are real, but chasing a younger person's numbers at an older age can require unsustainable caloric restriction that costs muscle mass.
Athletic Body Fat — By Sport
The ACE "athlete" category (6–13% men, 14–20% women) represents a wide range, and within competitive sport, where you fall depends heavily on what your sport demands physically.
| Sport / Activity | Men (Approx.) | Women (Approx.) |
|---|---|---|
| Marathon / endurance running | 5 – 11% | 10 – 16% |
| Cycling (road) | 6 – 12% | 12 – 18% |
| Swimming | 9 – 14% | 14 – 21% |
| Basketball / football | 8 – 15% | 14 – 21% |
| Powerlifting | 12 – 18% | 18 – 25% |
| Rugby / American football (linemen) | 14 – 22% | N/A (limited data) |
| Competitive bodybuilding (peak) | 3 – 6% | 10 – 14% |
| Recreational gym-goer | 14 – 20% | 20 – 27% |
While endurance and skill-position athletes often fall into the 6–13% range for men and 14–20% for women, athletes in power or collision sports may carry higher mass to absorb impact. A rugby prop at 18% body fat isn't carrying excess fat by athletic standards — the additional mass is functional. Competitive bodybuilders at peak week can reach 3–4% (men) verified by DEXA, but this is a brief, medically monitored state, not a sustainable or healthy long-term target.
Measuring Body Fat: Which Method to Use
Knowing the healthy ranges is only useful if you can get an accurate measurement. The methods available range from a bathroom scale app to clinical imaging, and their accuracy varies dramatically.
Body Fat vs BMI — When They Disagree
The scenario at the opening of this article — two identical BMIs, completely different body compositions — is more common than most people realize, and it has real consequences for how health risk gets assessed.
The problem runs in both directions. A muscular person with significant lean mass can register as "overweight" or even "obese" on the BMI scale despite having a body fat percentage firmly in the fitness or athlete range. Conversely, a person with low muscle mass and high fat can register as "normal weight" on BMI while carrying a body fat percentage that places them in a metabolically elevated risk category — a phenomenon sometimes called "skinny fat" or, more precisely, normal-weight obesity.
This doesn't mean BMI is useless — it's a practical, low-cost screening tool that works reasonably well for population-level analysis. It just means that for an individual trying to understand their actual body composition and health risk, body fat percentage provides a more complete picture. Used together, they give a better view than either one alone.
What Visceral Fat Is and Why It Matters More Than Total Fat
Not all body fat carries the same health risk, and this is a distinction that neither BMI nor a basic body fat percentage fully captures on its own. Fat can be stored in two main places:
- Subcutaneous fat — beneath the skin, the "pinchable" fat. Carries relatively low metabolic risk at moderate levels.
- Visceral fat — stored around internal organs in the abdominal cavity. Visceral fat releases inflammatory cytokines into the bloodstream, significantly increasing the risk of cardiovascular disease, type 2 diabetes, and hypertension.
Two people can have the same total body fat percentage but very different visceral fat levels — and the person with more visceral fat carries substantially more metabolic risk, even if their total percentage looks similar. This is part of why waist circumference and waist-to-hip ratio remain clinically relevant measurements even in an era of DEXA scanning: they provide a proxy for visceral fat distribution that a single body fat percentage number doesn't give you.
Men are more prone to visceral fat accumulation than pre-menopausal women, which is one reason cardiovascular risk tends to appear earlier in men. Post-menopause, the protective effect of estrogen diminishes and women's fat distribution often shifts toward more central/abdominal storage.
How Fast Can Body Fat Actually Change?
Understanding your current body fat percentage is only useful if you have a realistic sense of how quickly it can change — and the research on this is fairly clear, even if it conflicts with what most fitness marketing suggests.
Sustainable fat loss without significant muscle loss runs at roughly 0.5–1% of body weight per week under a moderate caloric deficit. For a 75kg person, that's about 375–750 grams per week of actual fat loss when conditions are optimal (adequate protein, resistance training, consistent deficit). In terms of body fat percentage points, this typically translates to roughly 0.5–1 percentage point per month for most people in the acceptable range.
| Starting Body Fat | Target | Estimated Timeline | Key Requirement |
|---|---|---|---|
| Men: 28% → 20% | 8 percentage points | 8–16 months | Moderate deficit + resistance training to preserve muscle |
| Men: 20% → 15% | 5 percentage points | 5–10 months | Tighter nutrition tracking — easier fat gets used first |
| Women: 35% → 28% | 7 percentage points | 7–14 months | Consistent deficit, protein prioritized at 1.6g+/kg |
| Women: 28% → 22% | 6 percentage points | 6–12 months | Resistance training critical to maintain lean mass |
These timelines assume a sustainable approach — not crash dieting. Fast weight loss almost always includes significant muscle loss alongside fat, which can paradoxically worsen body fat percentage relative to lean mass even as the scale drops. A person who loses 10kg quickly but loses 4kg of that as muscle ends up with a worse body composition ratio than if they'd lost the same 10kg slowly with muscle preserved.
The practical guidance from sports nutrition research: aim for 0.5–1% of bodyweight lost per week, prioritize protein at 1.6g/kg or above during a deficit, and include resistance training at least twice a week. These three factors together are what separate fat loss from weight loss.
Tracking Progress: What to Measure and How Often
One of the most common tracking mistakes is measuring body fat too frequently and drawing conclusions from single data points. Body fat percentage measurements — especially from the Navy method or BIA scales — are estimates with inherent margins of error. A reading that jumps 1–2% between measurements isn't necessarily a real change; it may just be measurement variance, hydration difference, or time of day.
The more useful approach is to track trends across multiple measurements rather than individual readings. A few practical guidelines:
- Measure at consistent conditions: Same time of day (morning, post-toilet, pre-food), same hydration state, same measurement technique. This minimizes the variables that create false fluctuations.
- Reassess every 4–6 weeks, not weekly: Over a month, real changes become statistically distinguishable from measurement noise. Weekly measurements with the Navy method or BIA often produce confusing results that don't reflect actual body composition change.
- Track alongside circumference measurements: Waist, hip, and thigh measurements change more visibly than body fat percentage in the early stages of a body recomposition effort, and they provide useful confirmation that something is actually changing.
- Note that the scale can be misleading during body recomposition: Someone simultaneously losing fat and gaining muscle may see little change in scale weight while their body fat percentage drops and their physique improves meaningfully. Body fat percentage tracking reveals this progress where scale weight hides it.
Frequently Asked Questions
What is a healthy body fat percentage?
According to ACE guidelines, healthy body fat for men falls between 14–24% (fitness to acceptable range) and for women between 21–31%. These ranges shift with age — older adults naturally carry a higher percentage without increased health risk. The "fitness" category (14–17% men, 21–24% women) is the range most associated with optimal metabolic health for active adults.
What is the difference between BMI and body fat percentage?
BMI uses only height and weight — it cannot distinguish muscle from fat. Two people at identical BMIs can have completely different body compositions and health risks. Body fat percentage directly measures what fraction of your weight is fat tissue versus lean mass, making it a more informative metric for body composition assessment.
What is essential body fat?
Essential fat is the minimum needed for basic physiological function — organ protection, nerve insulation, and hormonal production. For men, essential fat is 2–5%. For women, it's 10–13%, higher due to reproductive hormones. Dropping below essential fat causes serious health consequences including hormonal disruption and bone density loss.
Which body fat measurement method is most accurate?
DEXA scan is the gold standard, accurate to within 1–2%. For at-home use, the US Navy tape method is the most reliable practical option, estimating body fat within about 3–4% of DEXA for most people. Bioelectrical impedance scales (smart scales) are the least reliable, with results swinging by up to 8% based on hydration status alone.
Does healthy body fat percentage change with age?
Yes. Body fat naturally rises with age even when weight stays the same, primarily due to muscle mass decline. Clinical guidelines reflect this — a 55-year-old at 24% body fat may be in a perfectly healthy range, while a 25-year-old at the same figure would be slightly above optimal. Chasing a younger person's body fat target at an older age is often unnecessary and can come at the cost of muscle mass.
To get your estimated body fat percentage right now, our Body Fat Calculator uses the US Navy method to calculate your number in seconds. You can also pair this with your BMI and daily calorie needs for a more complete picture of your body composition and maintenance requirements.


Comments (0)
Leave a Comment